What are Options?
Imagine you want to buy an apple from Farmer John. John says he will give you an apple for $5. If you pay him $5, he gives you the apple, and it's a successful transaction. However, you don't have a fridge to store the apples. If you buy the apple now, you'll have to eat it immediately or else it will go bad. So you make a deal with John. You'll pay John $1 now, and in a year, John will sell you the apple for $5, and here's the important part, regardless of the price of the apple.
Now one year has passed, and you and John meet again. John tells you that his apples are $10 now. You remind him, however, that you had paid him $1 for the right to buy the apple for $5. John hands you the apple for $5 (plus the $1 you already paid a year back). And you just made a profit of (10 - (5 + 1)) = $4. 🔥
There is also a very real chance that John sells his apples for $2 instead of $10. Now if you went to buy it, you would lose (5 + 1) - 2 = $4. Instead, you don't buy the apple from him at all. You just lose $1 that you initially paid.
You spent $1 buying something called an option, and in fact, it's known as a call option.
"But wait", you might ask, "I still don't understand the terms in your calculator." Well, the $5 price of the apple initially is the strike price. The $10 price of the apple today is the stock price. The time to expiration is 1 year. The next two variables are a bit harder.
Imagine you put $5 in the bank instead of giving it to John. The bank gives you 5% interest rate. You would have $5.25 after a year. You made a "profit" of $0.25. But, if you bought the $10 apple for $5, you know you can earn a profit of $4 ($5 if you exclude the $1 you initially gave). So, it's a better idea to buy the apple. The risk-free interest rate (5% here) helps you compare these choices. You could earn $0.25 with NO risk, or $5 with SOME risk.
If John's apple prices fluctuate a lot, you have the potential to earn a lot more from the option. This makes the option itself more valuable. The higher the volatility, the higher your call price.
What about the $1 you paid initially? That's known as an option premium. John knows he can potentially lose out on making a better deal later, so he charges you $1 as compensation for that risk. He can't just give the options away - apples don't grow on trees (wait a minute 🗿).
Last thing before we move on to the model itself. Imagine you're an apple seller yourself, and John wants to buy some of your apples (he knows they taste better). So, you give HIM a deal now. "Here's $1. A year from now, I want the option to sell you an apple for $5, even if they're only worth $2 then." This is known as a put option. Short quiz: What is the $1 in this case?
What is the Black-Scholes Model?
What if you could mathematically determine the best call/put price for your options? The Black-Scholes model does exactly that. It takes in five variables (stock price, strike price, risk-free interest rate, time to expiration, volatility) and returns the call price. The solution to this partial differential equation for V is the call price.
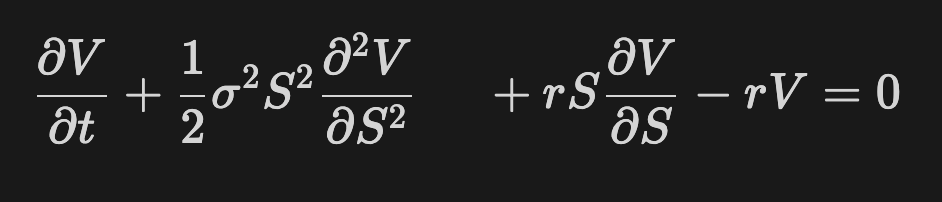
Looks difficult, doesn't it? Here's a simplified version that's easy to code with math libary functions and operators.
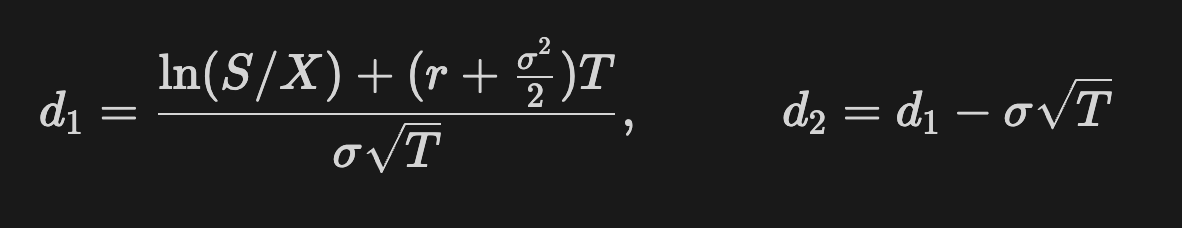
σ here stands for volatility. S is the stock price, X is the strike price (also known as exercise price), r is the risk-free interest rate, T is the time to expiration. These terms d1 and d2 are then used to calculate the call price.
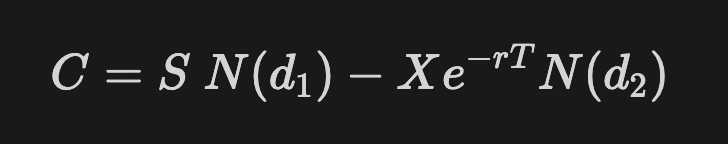
The function N(x) is the cumulative distribution function. It gives the probability that a standard normal variable is less than or equal to the parameter x. If that sounds too complex, just know that probabilities are always between 0 and 1, so N(x) lies between 0 and 1.
So, why do we use the Black-Scholes model? Imagine it gives a call price of $20. But, the trading exchange you're using is offering it for $15. You're essentially getting a discount of $5, so you buy the underpriced call option.
The Heatmap
A heatmap is a two-dimensional graph showing a function's outputs in various colors. It's a pretty easy graph to read once you understand it. This site lets you tweak the minimum and maximum value of the spot price and the volatility in the heatmap.
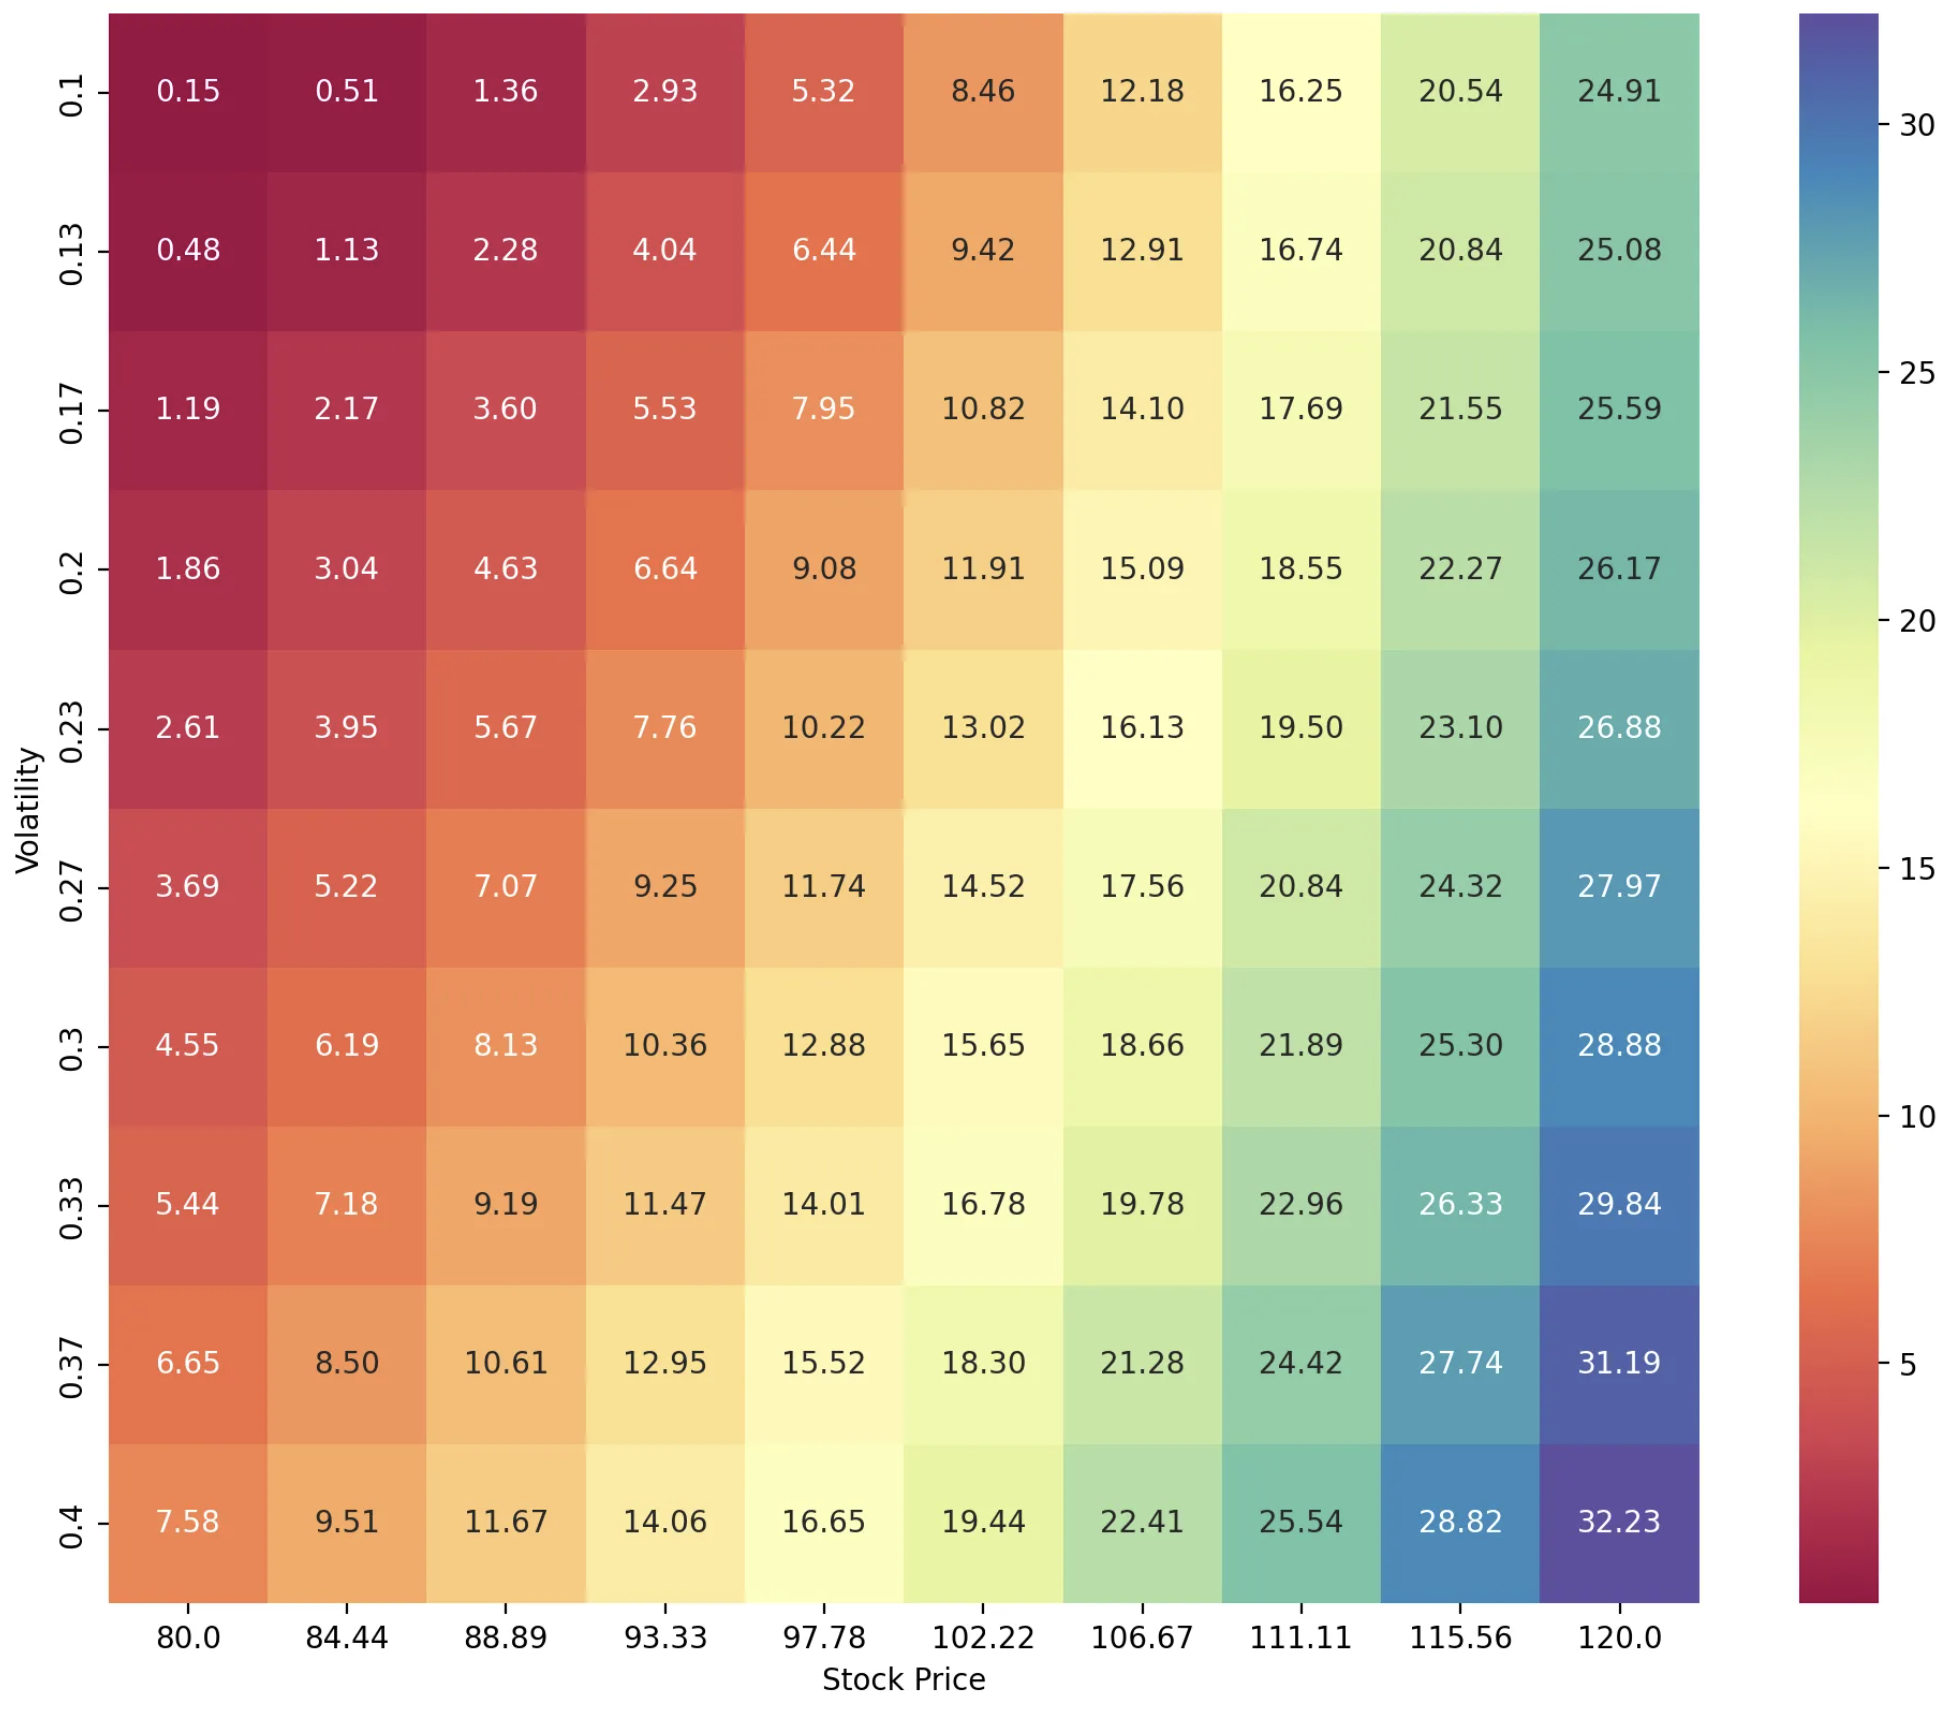
Every cell in the grid is the Black-Scholes value at the particular spot price on the x-axis and volatility on the y-axis, all other variables constant. Lower values are redder, higher values are bluer.
If you have the call price from your trading exchange, you can cross-check it with the heatmap to get the implied volatility (estimated volatility of the stock). Obviously, this assumes a fairly priced call option.
Made with by ari. Social links in navbar. Copyright © ari 2025. All rights reserved. Some rights reversed.
I hope you vote for my project!